Creating dashboards
Overview
Often, it is desired to get a quick overview of the business performance by monitoring the underlying processes. To achieve that, you can define reports in Camunda Optimize according to KPIs (Key Performance Indicators) relevant to your business objectives. A dashboard shows multiple reports, so you can get an up-to-date view of the productivity of your system.
The dashboard consists of the edit mode and view mode.
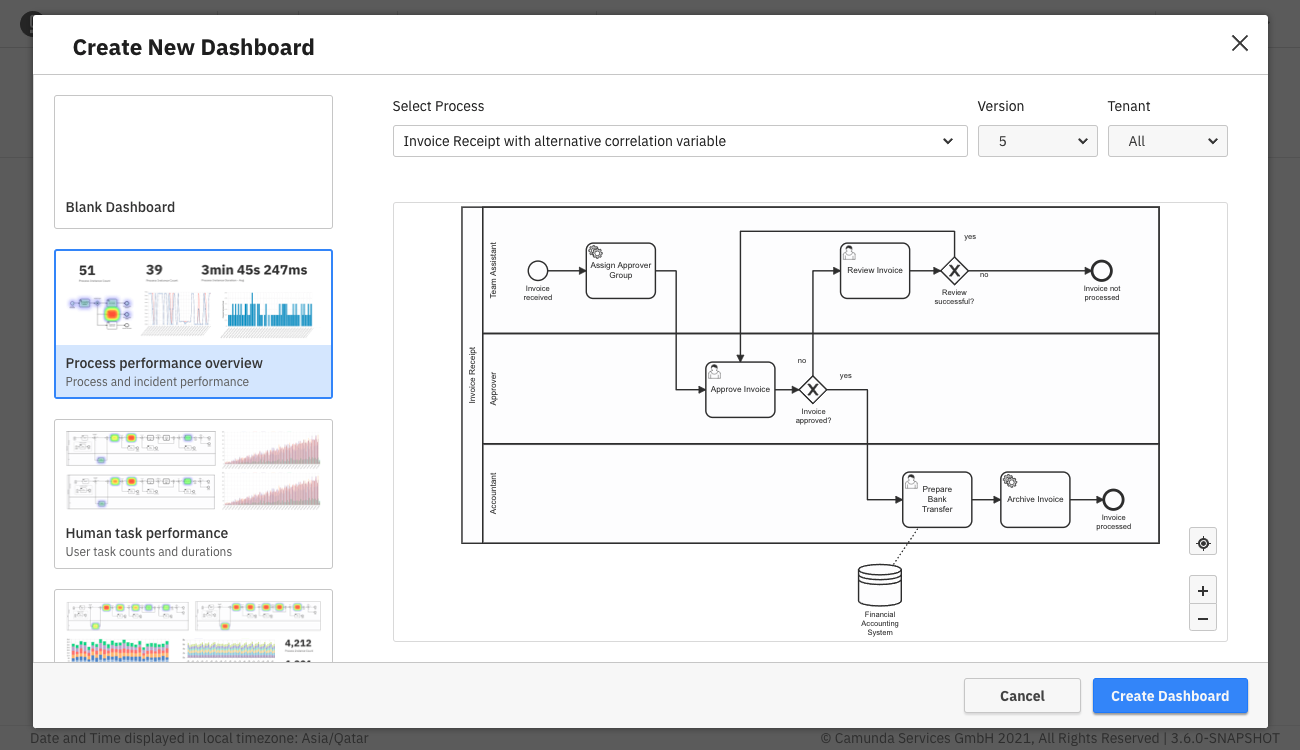
To create a new dashboard, click the Create New button on the homepage or collection page and select the New dashboard option. This opens a dialog where you can set the dashboard name and select one of multiple dashboard templates. When not creating a blank dashboard, select a process definition. This process definition is used to create new reports for the dashboard.
Creating a dashboard from a template also creates new reports which are saved as soon as the dashboard is saved.
Optimize offers collaborative capabilities, too. Click the Share tab to share a created dashboard. Toggle to Enable sharing, and copy or embed the provided link. Colleagues without access to Optimize can still view your report with the shared link. Learn more about user permissions.