Batch operations
When you create a batch operation, you provide filter criteria (such as process definition, version, or state) rather than a specific list of instances. The system then:
- Distributes the operation across all partitions in your cluster
- Each partition queries the secondary database to find matching instances
- Executes operations in parallel across partitions
- Tracks progress and aggregates results
This distributed approach enables efficient processing of large numbers of instances while maintaining cluster performance. Batch operations execute concurrently with regular partition processing—they do not block it. Just as multiple process instances can run in parallel on the same partition, batch operations process their target instances alongside all other partition activity without interruption.
Prerequisites
To use batch operations, you need:
- A Zeebe cluster with secondary storage configured (Elasticsearch or OpenSearch)
- Appropriate authorization permissions for the operations you want to perform
- Access to one of the following:
- Operate UI (for basic operations)
- Orchestration Cluster REST API (for full lifecycle management)
- Camunda Java client (for programmatic access)
Batch operation components
A Zeebe batch operation always consists of two parts:
-
The command:
The batch operation type determines the action performed on the process instances.
For example, the typeMIGRATE_PROCESS_INSTANCEmeans a request to migrate process instances to a new process definition version.
Some batch types require more details, such as a migration plan for process instance migration or a modification plan for process instance modifications. -
The batch operation items:
The items are not directly defined at creation. Instead, a filter describes them.
This filter is applied to the configured secondary database (for example, Elasticsearch) to identify matching process instances.
Batch operation lifecycle
Batch operations follow a structured lifecycle with distinct phases. Understanding these phases helps you monitor progress and troubleshoot issues.
1. Creation phase
What happens:
- User submits a batch operation request with filter criteria
- System performs validation checks
- The operation is distributed to all partitions in the cluster
- A leader partition is designated (the partition that first processes the creation command)
- All other partitions become follower partitions
- A unique batch operation key is generated and assigned
Duration: Milliseconds to seconds
What can go wrong: See Creation request validation below.
2. Initialization phase
What happens:
- Each partition queries the secondary database using the provided filter
- Results are paginated and split into manageable chunks to avoid overwhelming exporters (each item in a chunk triggers a separate export operation)
- The total number of items to process is determined and fixed at this point
- Signals are sent to start the execution phase once initialization is complete
Duration: Seconds to minutes, depending on the number of matching instances, cluster size, and whether other batch operations are already queued for initialization. If multiple batch operations are created, they are initialized sequentially. Each operation must finish its initialization phase before the next one begins.
API visibility: In Get Batch Operation API responses:
- The
operationsTotalCountbecomes eventually accurate once initialization completes on all partitions - The batch operation
statetransitions fromCREATEDtoACTIVEonce initialization finishes and execution is triggered
What can go wrong: See Initialization failures below.
Dependency on secondary storage
Although the broker's internal state stores process instance data, the secondary storage is queried because:
- RocksDB (our internal state database) is a key-value store, not optimized for complex queries.
- The secondary database (for example, Elasticsearch) efficiently supports complex filtering.
- The user interface enables filter-based batch creation, which RocksDB cannot support.
- Pagination and large result set handling is better supported by secondary databases.
3. Execution phase
What happens:
- Each partition processes its assigned items independently
- Individual commands (for example,
CANCEL,MIGRATE) are executed on each process instance - Progress is tracked and can be monitored
- Failed items are recorded with error details
Duration: Minutes to hours (depending on the number of instances and operation type)
Key characteristics:
- Fire-and-forget execution: Individual operation commands are dispatched immediately without blocking. While the system does not wait for each command to complete before dispatching the next one, you can still monitor overall batch progress and view failed items through the monitoring APIs.
- Independent processing: Each partition works independently, enabling parallel execution across the cluster
What can go wrong: See Execution failures below.
4. Completion phase
What happens:
- Follower partitions report completion or failure to the leader partition
- Leader partition aggregates results from all partitions
- Final status is determined (
COMPLETEDif at least one partition succeeded,FAILEDif all failed)
Duration: Seconds
Error handling and recovery
Creation request validation
Before processing begins, the system performs several validation checks:
- Empty filter validation: Filters cannot be empty or null
- Authorization validation: User permissions are checked before operation creation
- Command-specific validation: Each command type has specific requirements (for example, migration plan validity)
Failed validations result in immediate rejection with specific error codes and messages (for example, INVALID_ARGUMENT, NOT_AUTHORIZED).
Initialization failures
Initialization can fail for several reasons:
- Network issues: Connection problems with the secondary database
- Permission errors: Insufficient authorization to query the database
- Configuration issues: Secondary database not properly configured
- Query errors: Invalid or malformed filter criteria
Error handling behavior:
The system automatically handles initialization failures based on the error type:
- Retryable errors: Network issues, temporary database unavailability
- Uses exponential backoff with configurable retry limits
- Maximum delay and retry count can be configured
- Non-retryable errors: Permission issues, configuration problems
- Fail immediately without retries
- Adaptive sizing: If record size limits are exceeded, page sizes are automatically reduced
Execution failures
Individual items may fail during execution for various reasons:
- Process instance was completed or canceled after batch initialization
- Incident was already resolved by another operation
- Migration or modification plan is invalid for the specific instance
- Authorization insufficient for the specific process instance
The system marks failed items as FAILED and does not retry them within the same batch operation.
Recovery strategies
- Retry failed batches: Create a new batch operation with the same filter
- Partial recovery: Use more specific filters to target only failed items
- Monitoring: Use provided APIs to track which items failed and why
Lifecycle management
Batch operations support several lifecycle management operations:
Suspend and resume
- Suspend: Temporarily stops execution of a running batch operation
- Resume: Restarts execution of a suspended batch operation
- Operations can be suspended during initialization or execution phases
Cancel
- Cancel: Permanently stops a batch operation
- Cannot be resumed once canceled
- Partially processed items remain in their modified state
Batch operations in distributed clusters
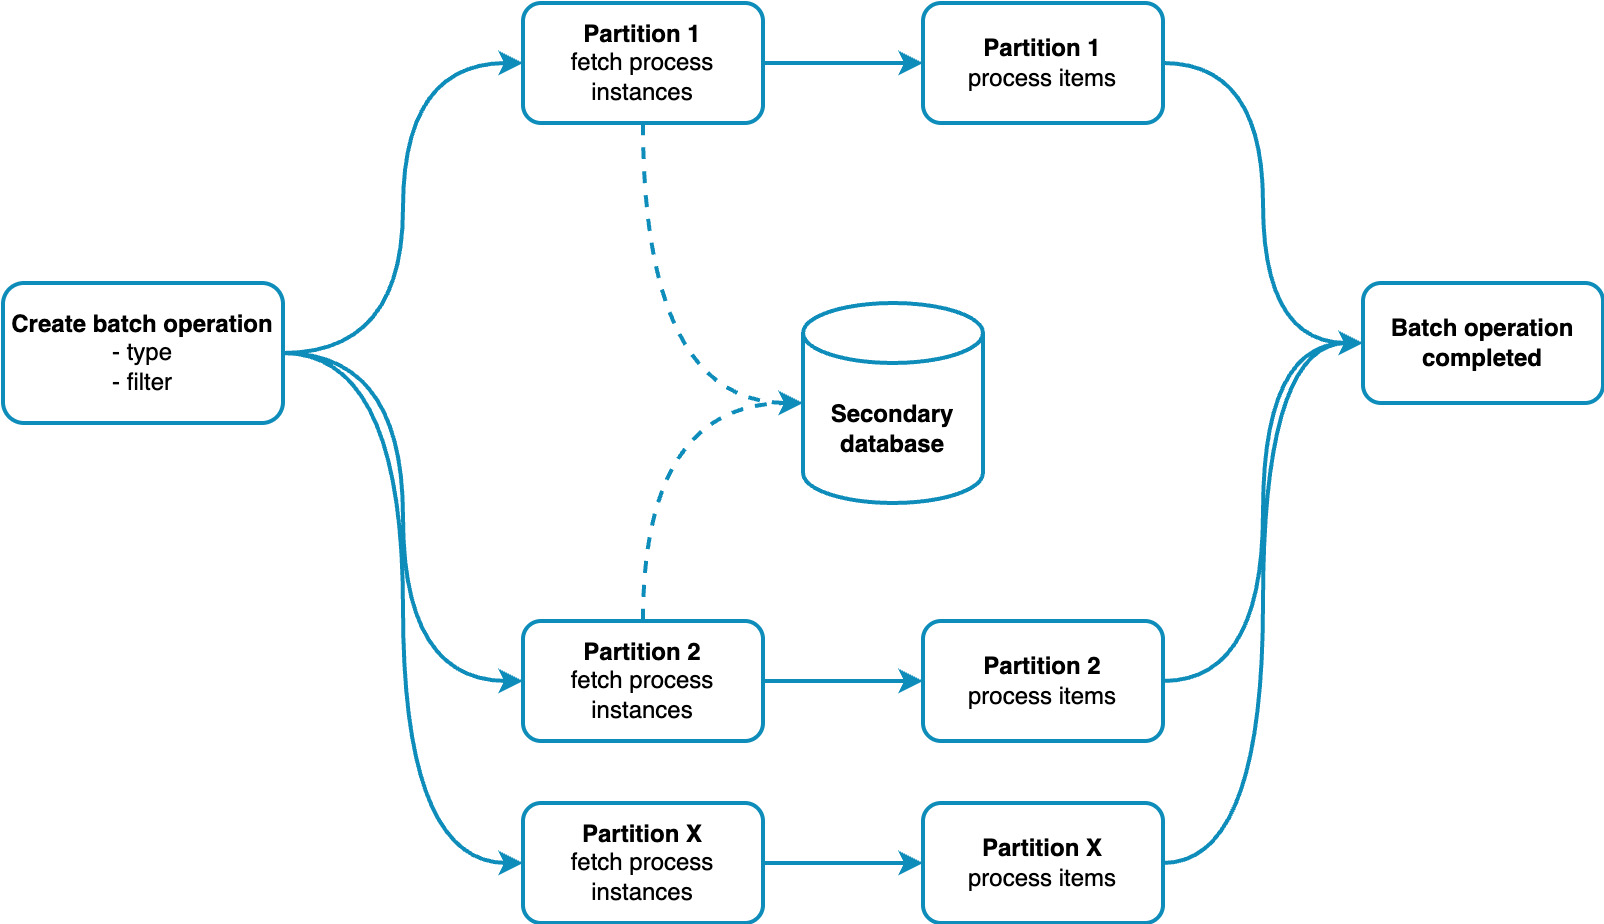
Zeebe clusters are distributed systems with multiple brokers and partitions. Each partition manages a subset of process instances.
When a batch operation starts:
- The batch operation (command + filter) is created and distributed to all partitions.
- Each partition processes the batch independently:
- It uses the filter to query relevant process instances from the secondary database.
- It applies the batch command to each matched instance.
- After all partitions finish, the final statuses are collected, and the batch is marked
COMPLETED.
This distributed, asynchronous approach allows parallel processing of many process instances.
Important considerations
Partition independence
Each partition fetches and processes matching instances independently.
At the start of very large batches, the total number of known items may vary until all partitions finish fetching.
This is due to multiple paged queries to the secondary database.
Leader-follower coordination
The leader partition coordinates the overall operation status while follower partitions focus on execution.
Inter-partition communication ensures consistent final status reporting.
How to create and monitor batch operations
You can create batch operations using:
- Operate UI: Start batch operations directly from the Operate interface for process instances and incidents
- Orchestration Cluster REST API: REST endpoints to create, manage, and monitor batches programmatically
- Camunda Java client: APIs for batch operations in Java applications
When you start a batch operation from Operate UI, the actual instances processed may differ from those displayed in the filter preview. The batch operation uses filter criteria to query the secondary database at execution time, and results may have changed since the preview was generated. The count is fixed when the batch starts and will not include instances created afterward.
Lifecycle management (suspend, resume, cancel) is only available via the REST API and Java client, not through Operate UI. More features may be added in future Operate versions.
Technical monitoring
Batch operation performance can be tracked via Grafana dashboards.
Key metrics to monitor:
- Initialization time and success rate
- Execution throughput and latency
- Error rates by type and partition
- Resource utilization during batch processing
- Secondary database query performance
Performance impact
Batch operations share cluster resources with regular process instances, affecting each other's performance. Commands created by batch operations run with the same priority as user-generated commands.
Performance considerations
During batch creation:
- RocksDB storage impact from batch metadata
- Memory usage for operation state management
During initialization:
- Heavy querying of the secondary database
- Network bandwidth usage for query results
- Partition coordination overhead
During execution:
- Command processing load shared with regular operations
- Potential backpressure on high-throughput scenarios
- Resource contention with live process instances
Best practices
- Timing: Schedule large batch operations during low-traffic periods
- Sizing: Break very large operations into smaller batches
- Monitoring: Watch cluster performance metrics during batch execution
- Filtering: Use precise filters to minimize unnecessary processing
Large batch operations can temporarily impact cluster performance, especially during initialization when partitions query the secondary database individually and in parallel.
Heavy querying of the secondary database can notably affect its performance, especially for large batches with broad filters.
Configuration
Batch operation behavior can be configured through broker settings under camunda.processing.engine.batch-operations.*. All settings are validated at startup, and invalid values will cause the broker to fail with a descriptive error message.
Default values are optimized for typical workloads. Only adjust these settings if you experience performance issues or have specific requirements.
Scheduler settings
Controls how frequently the batch operation scheduler checks for work:
| Parameter | Type | Default | Description |
|---|---|---|---|
schedulerInterval | Duration | PT1S | How often the background scheduler runs to progress initialization and continuation of batch operations. Impact: Lower values provide faster responsiveness but increase CPU usage. |
Chunking and pagination settings
Controls how batch operations split large result sets into manageable pieces:
| Parameter | Type | Default | Description |
|---|---|---|---|
chunkSize | int | 100 | Maximum number of items per chunk. This controls both the number of items written per chunk record during initialization and the number of items stored per chunk in RocksDB state. Note: The default value of 100 is a reasonable tradeoff between the number of records and exporter performance. Values greater than 3000 are not recommended, as the broker logs a warning. Higher values may lead to performance issues in the exporters and can exceed the 4 MB record size limit. RocksDB optimization: A chunk size of 3000 item keys results in approximately 24 KB (31 KB with overhead), which aligns well with RocksDB's 32 KB block size for efficient read/write performance. |
queryPageSize | int | 10000 | Page size when querying the secondary database during initialization. For Elasticsearch/OpenSearch: This interacts with the default 10,000 result window limit. |
queryInClauseSize | int | 1000 | Maximum number of keys in a single IN clause when querying by key list. Use case: Primarily for RDBMS-based secondary databases. |
Retry and error handling settings
Controls how the system handles transient failures when querying the secondary database:
| Parameter | Type | Default | Description |
|---|---|---|---|
queryRetryMax | int | 0 | Maximum number of retry attempts for transient query failures (for example, network timeouts, temporary database unavailability). Default behavior: Retries are disabled by default (set to 0). Set to a higher value to enable retries. |
queryRetryInitialDelay | Duration | PT1S | Initial delay before the first retry attempt. Behavior: Each subsequent retry uses exponential backoff. |
queryRetryMaxDelay | Duration | PT60S | Maximum delay between retry attempts. Constraint: Must be greater than or equal to queryRetryInitialDelay.Purpose: Prevents excessive wait times. |
queryRetryBackoffFactor | double | 2.0 | Multiplier applied to the delay between consecutive retries. Example: With factor 2.0 and initial delay PT1S, retries occur at 1s, 2s, 4s, 8s, and so on (capped by queryRetryMaxDelay). |
Configuration example
# In your broker configuration file (for example, broker.yaml)
camunda:
  processing:
    engine:
      batch-operations:
        # Scheduler
        scheduler-interval: PT1S

        # Chunking and pagination
        chunk-size: 100
        query-page-size: 10000
        query-in-clause-size: 1000

        # Retry and error handling
        query-retry-max: 0
        query-retry-initial-delay: PT1S
        query-retry-max-delay: PT60S
        query-retry-backoff-factor: 2.0
Tuning recommendations
For large batch operations (100,000+ instances):
- Consider reducing
chunkSizeto500or lower to reduce memory pressure - Reduce
queryPageSizeif you encounter Elasticsearch/OpenSearch query timeouts
For high-throughput environments:
- Increase
schedulerIntervaltoPT5SorPT10Sto reduce scheduler overhead - Monitor partition CPU usage and adjust accordingly
For unreliable network connections:
- Increase
queryRetryMaxto5or higher - Increase
queryRetryMaxDelaytoPT120Sfor longer retry windows
The engine enforces a 4MB per-record limit. If initialization queries return very large result sets, the scheduler automatically splits them across multiple chunk records. Prefer tuning chunkSize and queryPageSize rather than increasing global message size limits.
For backward compatibility, the legacy configuration path zeebe.broker.experimental.engine.batchOperations.* is still supported. However, the unified configuration format shown above (camunda.processing.engine.batch-operations.*) is recommended for new deployments.
Exporter configuration
If you use the Camunda Exporter (Self-Managed with Elasticsearch/OpenSearch), you can control whether pending batch items are exported immediately at batch creation.
Camunda exporter exportItemsOnCreation
| Parameter | Type | Default | Description |
|---|---|---|---|
batchOperation.exportItemsOnCreation | boolean | true | Controls whether pending batch items are exported to Elasticsearch/OpenSearch immediately when batch initialization starts. When enabled: Operate can display a loading spinner indicating pending batch operations. |
When to disable:
For very large batches (100,000+ items), enabling this option causes a temporary spike in write load due to the high volume of document insertions into the secondary database. If you experience performance issues during batch creation, consider setting this to false.
Trade-offs:
- Enabled (
true): Operate UI shows real-time progress indicators, but may cause indexing pressure - Disabled (
false): Reduces initial indexing load, but Operate UI won't show the progress spinner. Use the REST API batch status endpoints and Grafana metrics for monitoring instead.
Configuration example:
# In your broker configuration file (for example, broker.yaml)
zeebe:
  broker:
    ...
    exporters:
      camundaexporter:
        args:
          batchOperation:
            exportItemsOnCreation: false