Agentic control plane
Monitor AI agent adoption, token costs, reliability, and performance across your processes with the agentic control plane in Optimize.
About
With the agentic control plane in Optimize, you can monitor AI agents adoption, token usage, reliability, and performance across your processes in one place.
This is primarily intended for operators, process owners, and engineering leads who manage AI-agent-powered processes and need to keep them reliable and cost-effective.
If you need customized metrics beyond those available in this feature, you can also build your own AI agent reports and dashboards in Optimize.
Open the agentic control plane
- Open Optimize.
- In the navigation, select Agentic Control Plane.
- The Agentic Control Plane page loads, showing metrics for all your agentic processes from the last 30 days.
Optimize is disabled by default on new trial clusters. If the Agentic Control Plane tab doesn't appear in the navigation, an admin needs to enable Optimize first using the Enable Optimize prompt on the cluster overview. Upgrading from a trial to a paid plan enables Optimize automatically.
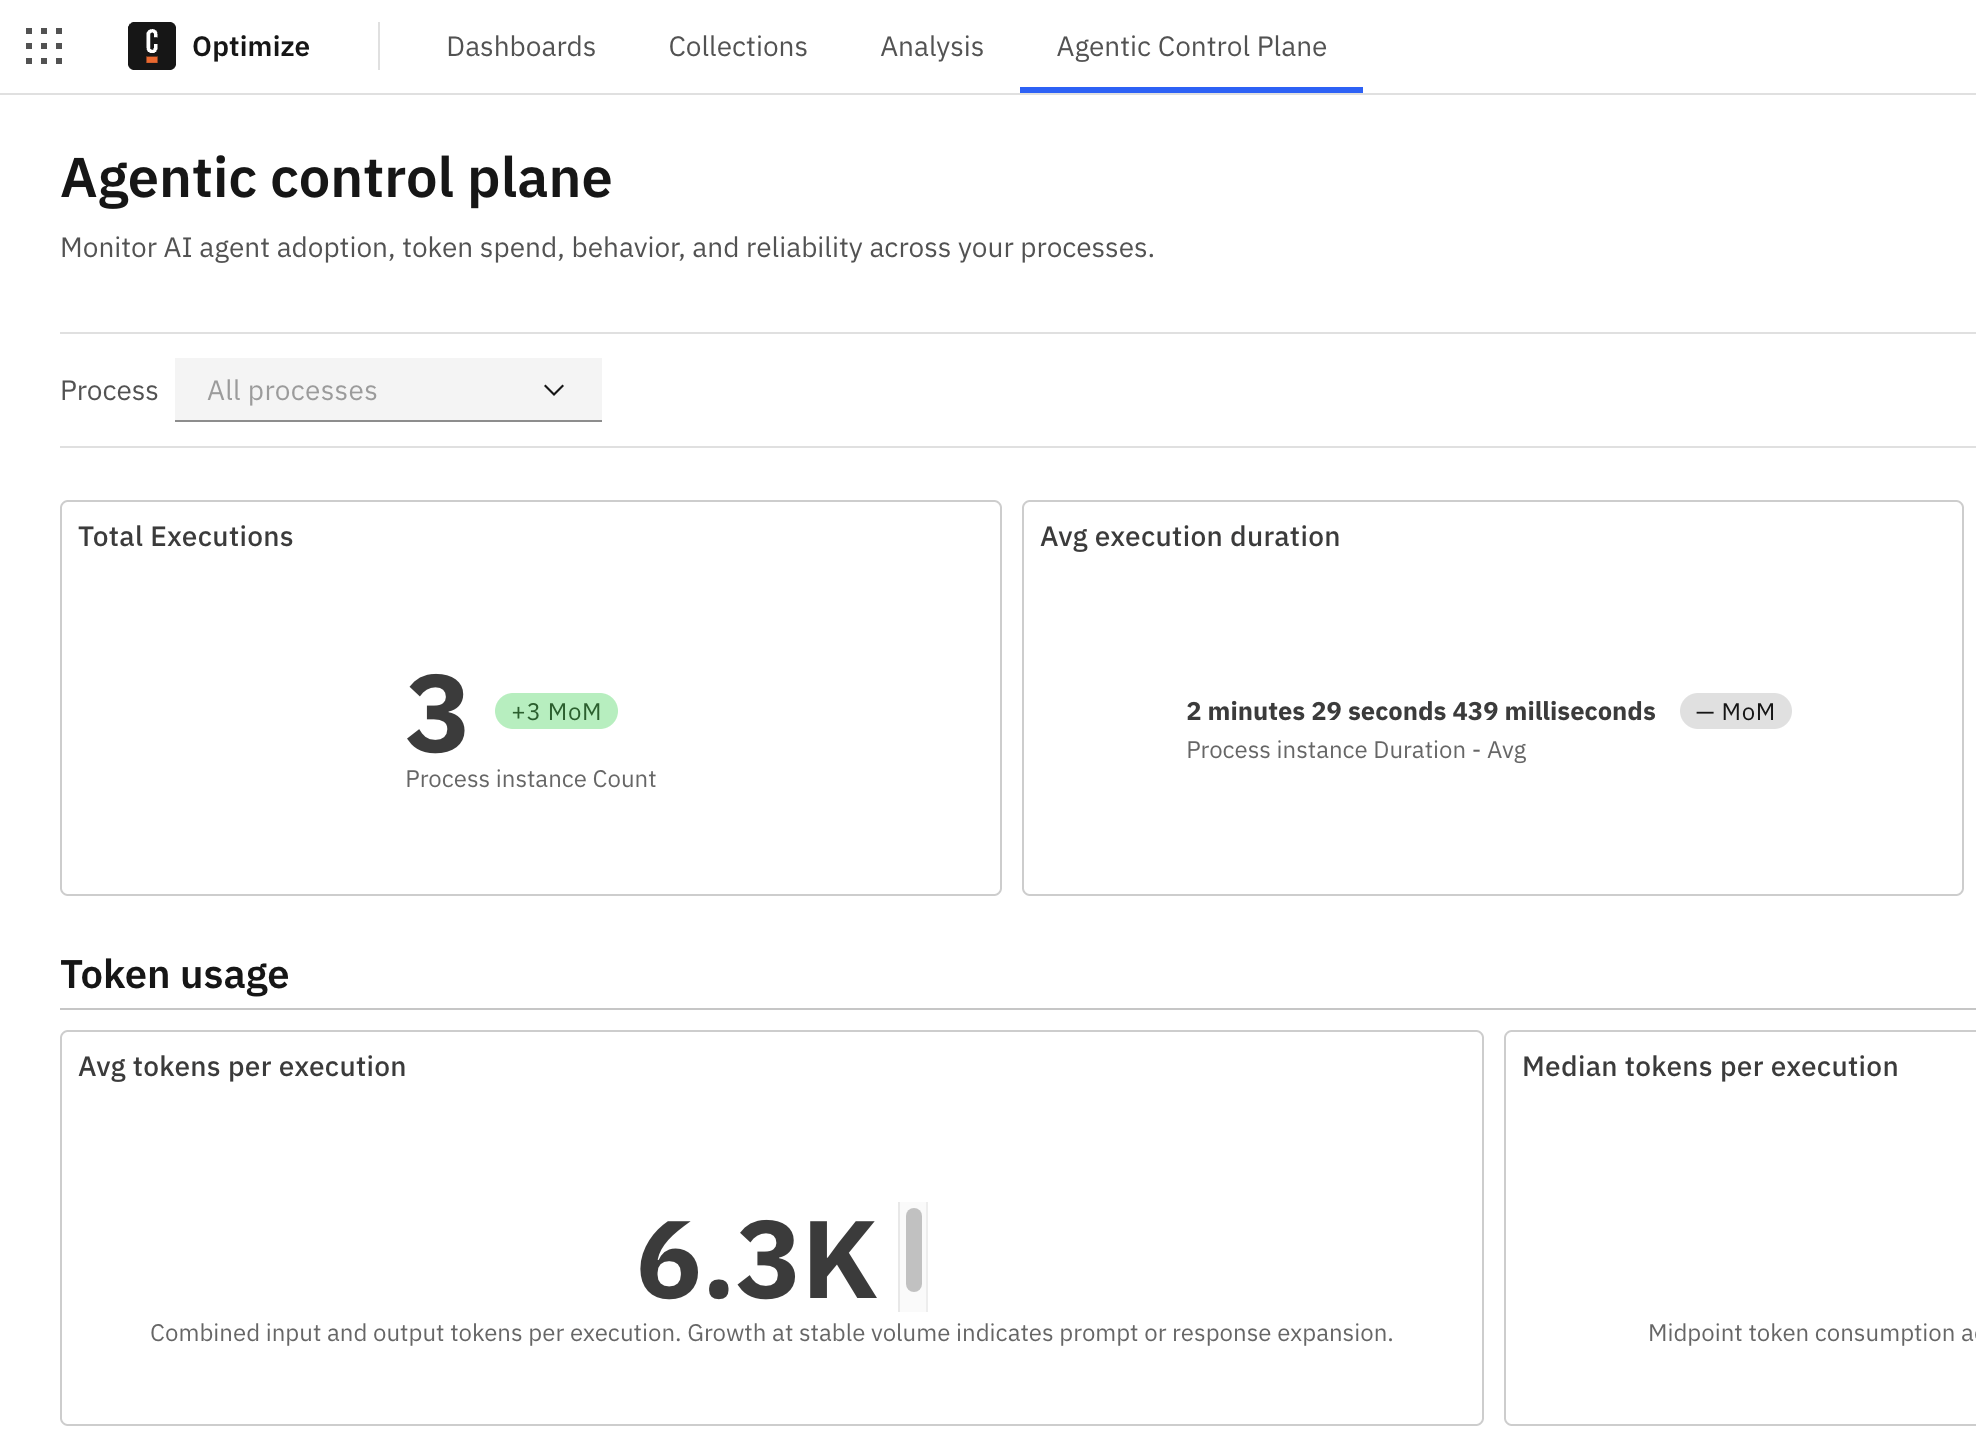
Overview and process views
The Agentic Control Plane page has two views, controlled by the Process filter at the top:
- Overview (default): No process is selected, so you see every agentic process together. It covers every agentic process in the current Optimize instance (current cluster), not an organization-wide view across multiple clusters.
- Process view: Select one process (and optionally a Version). Every metric now describes just that process, including extra process-specific metrics.
To switch views, choose a process in the filter, or clear it to return to the overview.
A process instance counts as agentic and is included in the metrics if it contains at least one execution of a Camunda AI agent, for example through the AI Agent connector.
Processes that call only external agents aren't tracked because the Camunda engine has no visibility into their execution.
Filters
Use these filters to narrow the metrics down to the time window, process, or version you want to inspect:
- Date range: Last 7 days, Last 30 days (default), Last 3 months, Last 6 months, or Last 12 months. Dates are based on when each execution completed. Chart time buckets adjust automatically (for example, daily for a week, monthly for a year).
- Process: switches between the overview and the process view.
- Version: appears only in the process view. Focus on a specific process version, the latest, or all versions.
Metrics available in each view
| Metric | Overview | Process view |
|---|---|---|
| Total executions | ✅ | ✅ |
| Average execution duration | ✅ | ✅ |
| Incident rate | ✅ | ✅ |
| Average tokens per execution | ✅ | ✅ |
| Median tokens per execution | ✅ | ✅ |
| Token trend | ✅ | ✅ |
| Token outlier bands (P5 / P50 / P95) | ✅ | ✅ |
| Top token consumers by process | ✅ | — |
| Total tool calls | ✅ | ✅ |
| Failure rate by process version | — | ✅ |
| Tool calls per flow node (heatmap) | — | ✅ |
| P50 execution duration | ✅ | ✅ |
| P95 execution duration | ✅ | ✅ |
| Execution duration stability | ✅ | ✅ |
| Duration per flow node (heatmap) | — | ✅ |
Understand the metrics
The available metrics are grouped into four themes: key numbers, token usage, reliability and tool calls, and duration. Each one is described below, along with what it tells you and how to act on it.
The metrics only reflect completed process instances that used at least one Camunda AI agent. This excludes both normal in-flight runs and agents stuck mid-execution, such as an agent hanging on a tool call. As a result, a hung agent won’t appear in Incident rate until its instance completes. If a metric looks empty, there's usually no agentic data yet for the selected process or period.
Key numbers
The top row gives you an at-a-glance health check, and each number carries a change badge comparing the current period to the previous one.
- Total executions counts the completed agentic executions in the period. It's your adoption and volume signal: a steady climb means agents are being used more, while an unexpected drop can mean a process has stalled. It also sets the scale for reading every other metric.
- Average execution duration shows the average end-to-end time of an agentic execution. If it trends upward, the experience is getting slower, and it's worth digging into the duration metrics or a specific process to find out why.
- Incident rate is the share of completed executions that hit and resolved an incident, a quick reliability pulse. When it starts climbing, that's your cue to investigate. In the process view, Failure rate by process version helps you narrow down the cause.
Token usage
Tokens are the units of AI model usage, so this group is effectively about cost.
- Average tokens per execution captures the typical cost of a single run as the combined input and output tokens. When it grows while your execution volume stays flat, prompts or responses are expanding, which is a good moment to review your prompt design.
- Median tokens per execution is the midpoint: half of executions use less, half use more. Because it ignores extreme outliers, it represents the typical run. Compare it against the average: a large gap means a handful of very expensive runs are inflating your costs, so it's worth hunting down those outliers.
- Token trend plots input tokens against output tokens over time. It reveals where cost growth comes from: bigger prompts push up the input line, longer responses push up the output line. If tokens rise without more executions, your prompts may be growing, or the model may be producing longer answers, which is worth raising with engineering.
- Token outlier bands (P5 / P50 / P95) show the spread of per-execution token usage over time, from low to typical to high. A widening gap between the P5 and P95 bands means executions are behaving inconsistently, often a sign of prompt variability or non-determinism.
- Top token consumers by process ranks your processes by total token spend, showing the top 10 as a bar chart. This is where you see where the money goes across all processes: cutting the top consumer has the biggest impact on overall spend, and you can select that process to drill into it in the process view. A Top X of Y note appears when more processes exist beyond those shown.
Reliability and tool calls
- Total tool calls is the total number of tool or action calls your agents made, a gauge of how much work they delegate to tools. Sudden changes can point to a behavior shift or a looping agent, so it's useful to read alongside token usage and duration.
- Failure rate by process version breaks the failure percentage down by process definition version. It answers whether a specific version is more or less reliable, so you can confirm whether a new release improved or regressed things and decide whether to roll it back or promote it.
- Tool calls per flow node overlays a heatmap on the process diagram, coloring each step by how many tool calls it triggers. It pinpoints where in the process your agents do the most work, so you can target the hottest steps for review, such as a tool an agent calls far more often than expected.
Duration
- P50 execution duration is the median execution time: half of runs finish faster, half slower. It gives you the typical performance experience and a stable baseline to compare against P95 and over time.
- P95 execution duration exposes the slow tail: 95% of executions finish within this time. It surfaces worst-case slowness that averages tend to hide. When P95 sits far above P50, a meaningful minority of runs are slow, and those are the cases worth investigating.
- Execution duration stability (P50 / P95) plots both the median and 95th-percentile duration over time on a single chart. It shows whether performance is steady or drifting, helping you catch gradual degradation, or a widening gap between typical and worst-case runs, before users start to complain.
- Duration per flow node overlays a heatmap on the process diagram, coloring each step by its average duration. It shows which steps consume the most time so you can focus performance work on the true bottlenecks. Like the other heatmap, it's only available in the process view.
Find the right metrics for your goal
With these metrics in mind, you can complete a few common tasks:
- Watch adoption: keep the overview on Last 30 days and track Total executions.
- Control cost: check Average tokens per execution, Median tokens per execution, and Token trend. If they're rising, open Top token consumers by process, select the top process, and investigate it in the process view.
- Investigate reliability: when Incident rate climbs, switch to the affected process and use Failure rate by process version to see whether a release caused it.
- Find slow or busy steps: in the process view, use Duration per flow node to pinpoint bottlenecks and Tool calls per flow node to see where agents do the most work.