Cluster Metrics endpoint
The Cluster Metrics endpoint lets you expose metrics from a Camunda 8 SaaS Orchestration cluster and consume them in your own monitoring system.
About
Use this endpoint to monitor cluster performance, set alerts, and correlate Camunda metrics with the rest of your infrastructure using your existing observability tools.
This endpoint is a dedicated, customer-facing metrics service that exposes aggregated component-level metrics. The endpoint is separate from Camunda’s internal monitoring and operational systems and provides access only to metrics intended for customer consumption.
Before you begin
Before using the Cluster Metrics endpoint, ensure that:
- You have an external monitoring system capable of collecting prometheus metrics.
- You understand your organization’s network access and IP allowlisting requirements.
Supported environments
- The Cluster Metrics endpoint is available for all Camunda 8 SaaS Orchestration clusters.
- The endpoint is configured per Orchestration cluster and can be enabled without requiring an upgrade or downtime.
Metrics exposure model
The Cluster Metrics endpoint exposes metrics using a pull-based model and Prometheus-compatible format (Prometheus and OpenMetrics text exposition formats).
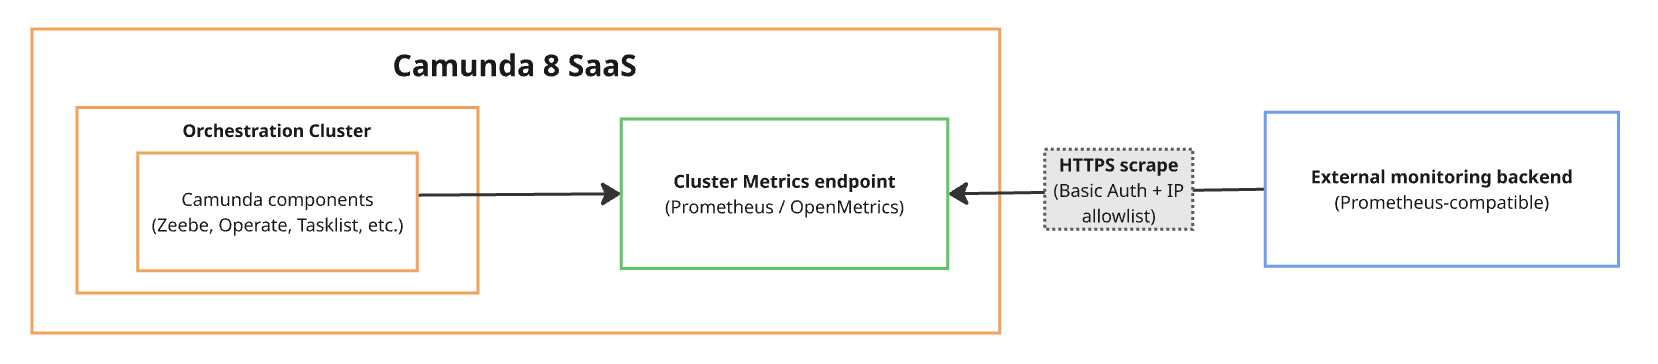
When the Cluster Metrics endpoint is enabled for a cluster:
- Camunda exposes a cluster-scoped metrics endpoint that aggregates metrics from all Orchestration cluster components.
- Metrics are exposed in Prometheus-compatible format.
- Your monitoring system initiates metric collection by scraping the endpoint.
The Cluster Metrics endpoint does not push metrics to customer systems.
Monitoring endpoint constraints
The Cluster Metrics endpoint exposes the application-level metrics produced by the Camunda version running in your cluster.
The following constraints apply:
- The Cluster Metrics endpoint uses Basic authentication only.
- Metric names and labels depend on the Camunda version running in your cluster.
- Metric and dashboard compatibility between Camunda versions is not guaranteed.
If your monitoring system does not support Prometheus scraping, you can adapt the metrics using a self-managed OpenTelemetry Collector. For more information, see Integrate non-Prometheus monitoring systems.
Next steps
- To enable the Cluster Metrics endpoint and obtain connection details, see Set up the Cluster Metrics endpoint.
- To configure Prometheus to scrape metrics, see Configure monitoring systems to scrape metrics.
- If your monitoring system does not support Prometheus scraping, see Integrate non-Prometheus monitoring systems.