Cluster load
Use the cluster load metric to view and manage your cluster load and utilization.
About cluster load
The cluster load metric provides a high-level overview of how well a cluster is coping with its current workload.
- Use this information to check and monitor if a cluster is appropriately sized for its workload.
- Cluster load can also be used as an indicator of cluster health. For example, a cluster running at maximum load can indicate poor cluster responsiveness.
A general guideline to follow when using the cluster load metric is:
-
High cluster load percentage: The higher the cluster load percentage value, the more likely it is that things will slow down, time out, requests will fail, and so on. For example, if a cluster is continually running at 95% load, this means the cluster is probably overloaded and may not be performing well.
-
Low cluster load percentage: The lower the cluster load percentage value, the more you could increase the cluster workload as the cluster is probably underused. For example, if a cluster load is only 5% then the cluster can probably accept more workload and may be underused.
To understand how cluster load is calculated, see how cluster load is calculated.
View cluster load
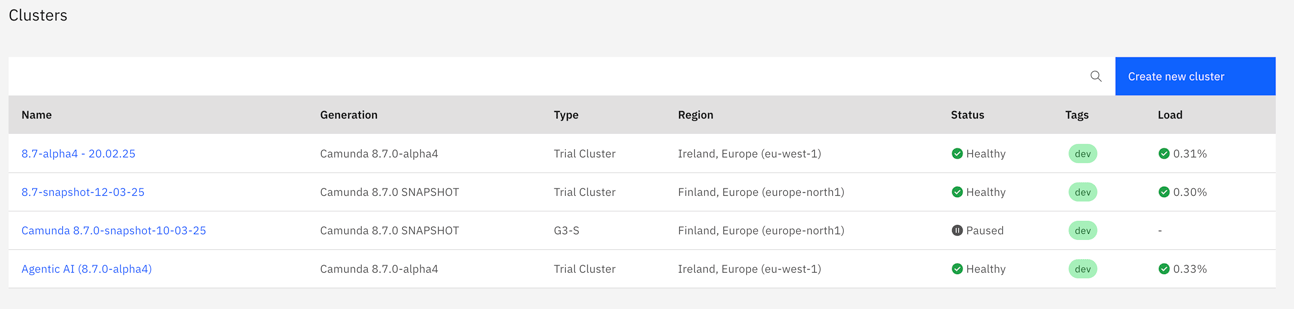
If your cluster supports load monitoring, the cluster load percentage is shown in the Load column on the Console Clusters tab.
Select a cluster to view detailed cluster load information on the cluster Overview tab.
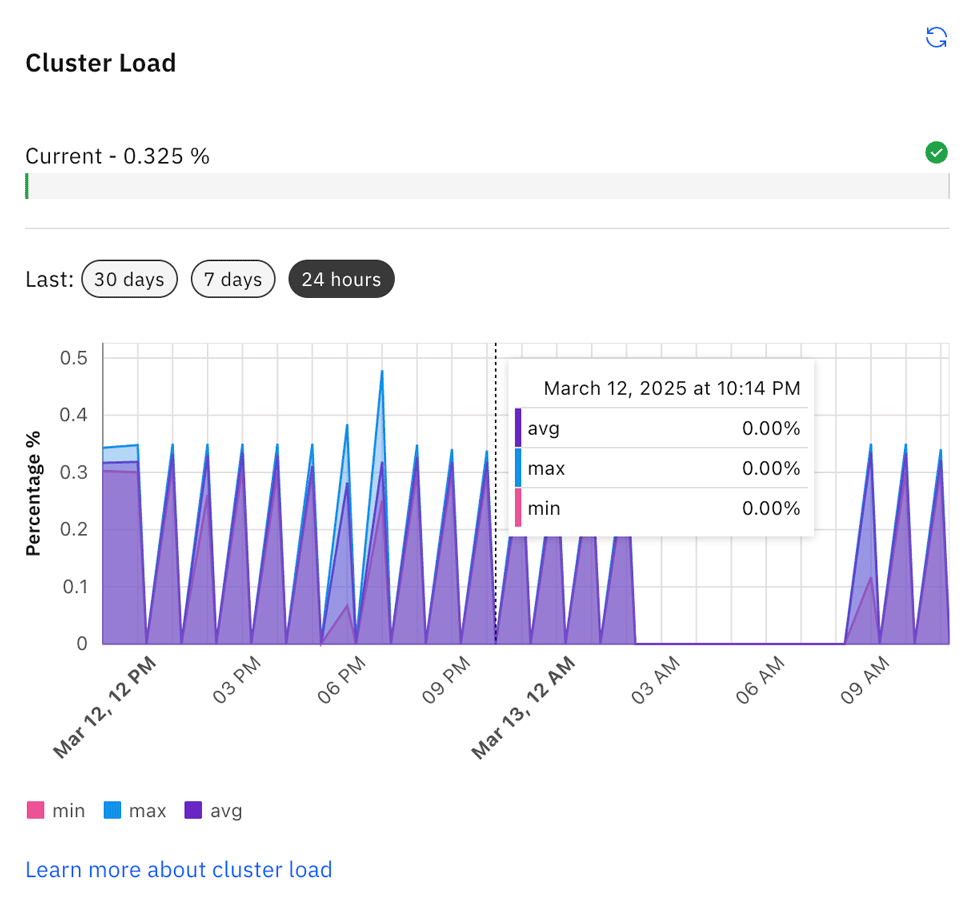
- The current cluster load is shown as a percentage bar at the top of the section.
- The chart shows detailed cluster load data for the last 24 hours, 7 days, or 30 days.
- Select the time period you want to view data for.
- Hover over individual nodes in the chart to view data for a specific time or day.
- Click the Refresh icon to refresh and update the cluster load data.
Manage cluster load
Cluster load will fluctuate based on incoming user requests, and internal processing load.
- User requests are those sent directly by an external client.
- Internal load refers to all other processing that is not directly triggered by a client. For example, timer events, a job being made available after back off, and so on.
This means that cluster load could fluctuate throughout the day. For example:
- Cluster load might be higher during business hours, but lower overnight when the cluster is unused.
- Certain processes can cause a "fan-out" effect, where even though creating a process instance is only a single user request, it could require computation on a very large multi-instance collection, resulting in a high cluster load spike.
- You could have a spike in cluster load if a large number of timers are triggered at the same time.
High cluster load percentage
A high cluster load percentage and utilization does not necessarily mean that a cluster needs to be resized, but it could indicate that your cluster is overloaded.
A high cluster load percentage benchmark is relative, but generally anything above 60% is considered high.
If your cluster load and utilization is too high, but your operations are completing within an acceptable timeframe, requests are successful, and so on, you do not need to take any action.
However, if you find yourself experiencing any of the following issues, you might need to investigate and take action:
- REST clients are receiving a high number of
429errors. - gRPC clients are receiving a high number of
RESOURCE_EXHAUSTEDerrors. - More and more commands or queries are timing out in your clients.
- Web components are slowing down, or showing data that is severely out of date (for example, 1 hour).
In this scenario, you should look at reducing the overall load on the cluster.
Reduce cluster load
If your cluster load and utilization is too high, you can help reduce it by:
- Scaling down the load. For example, by stopping certain clients. Start with your least critical load, and continue from there.
- Check your running process instances for known issues that cause high processing, such as:
- Straight-through processing loops, where there are no wait states. For example, a sub process with an error boundary event which loops back to an activity leading into the sub-process. If you have an activity which consistently throws an error, this will result in a subtle infinite loop where the engine is stuck and cannot process anything else. You would have to cancel this instance, or contact support to force cancel it for you.
If your cluster load percentage remains high even after attempts to reduce it, you might need to increase your cluster size and scale. See cluster size and sizing your environment.
How cluster load percentage is calculated
Cluster load percentage is based on the cluster's flow control configuration.
Essentially, if flow control is configured, every partition is assigned a write rate and a write rate limit.
This means a partition's cluster load is defined as:
(writeRate / writeRateLimit)
This gives a value between 0 and 1, which is multiplied by 100 to give the partition load as a percentage.
The cluster load percentage is then the average of the load of all partitions in the cluster.
- The partition load is only calculated and reported on the current partition leader.
- It typically takes about five minutes for cluster load data to update with the latest information.