Analyze your AI agents with Optimize
Analyze and improve the performance of your AI agent executions using Optimize.
About
In this guide, you will:
- Understand what data Optimize can analyze for AI agents.
- Create reports and heatmaps, including token and tool usage.
- Build a dashboard to track AI agent behavior over time.
After completing this guide, you will be able to analyze AI agent executions in Optimize and build dashboards that track usage and performance trends.
Prerequisites
- You have access to Optimize.
- You have deployed and run the AI Agent Chat Quick Start model blueprint. This is needed for Optimize to fetch execution data to analyze. Consider running it using different prompts to trigger various AI agent tools.
This guide is a follow-up to Build your first AI agent, in which you use the same example AI agent process. We recommend completing that guide first. However, you can also apply this guide to other AI agent process implementations.
Step 1: Make your data available
To make data available to Optimize, make sure it's scoped at the process level. If it's scoped to a lower level, for example, within a connector or tool-execution scope, extract it into process variables.
Optimize can only use variable data at the process level.
Example: Collect token usage
In the AI Agent Chat Quick Start example, token usage data is not available at the process level, but in a nested scope. How you extract it depends on your AI agent implementation. The important aspect is that the target variables exist at the process level when the instance finishes.
Getting the token usage from the agent context only works with the AI Agent Sub-process when the Include agent context option in the Response section is enabled.
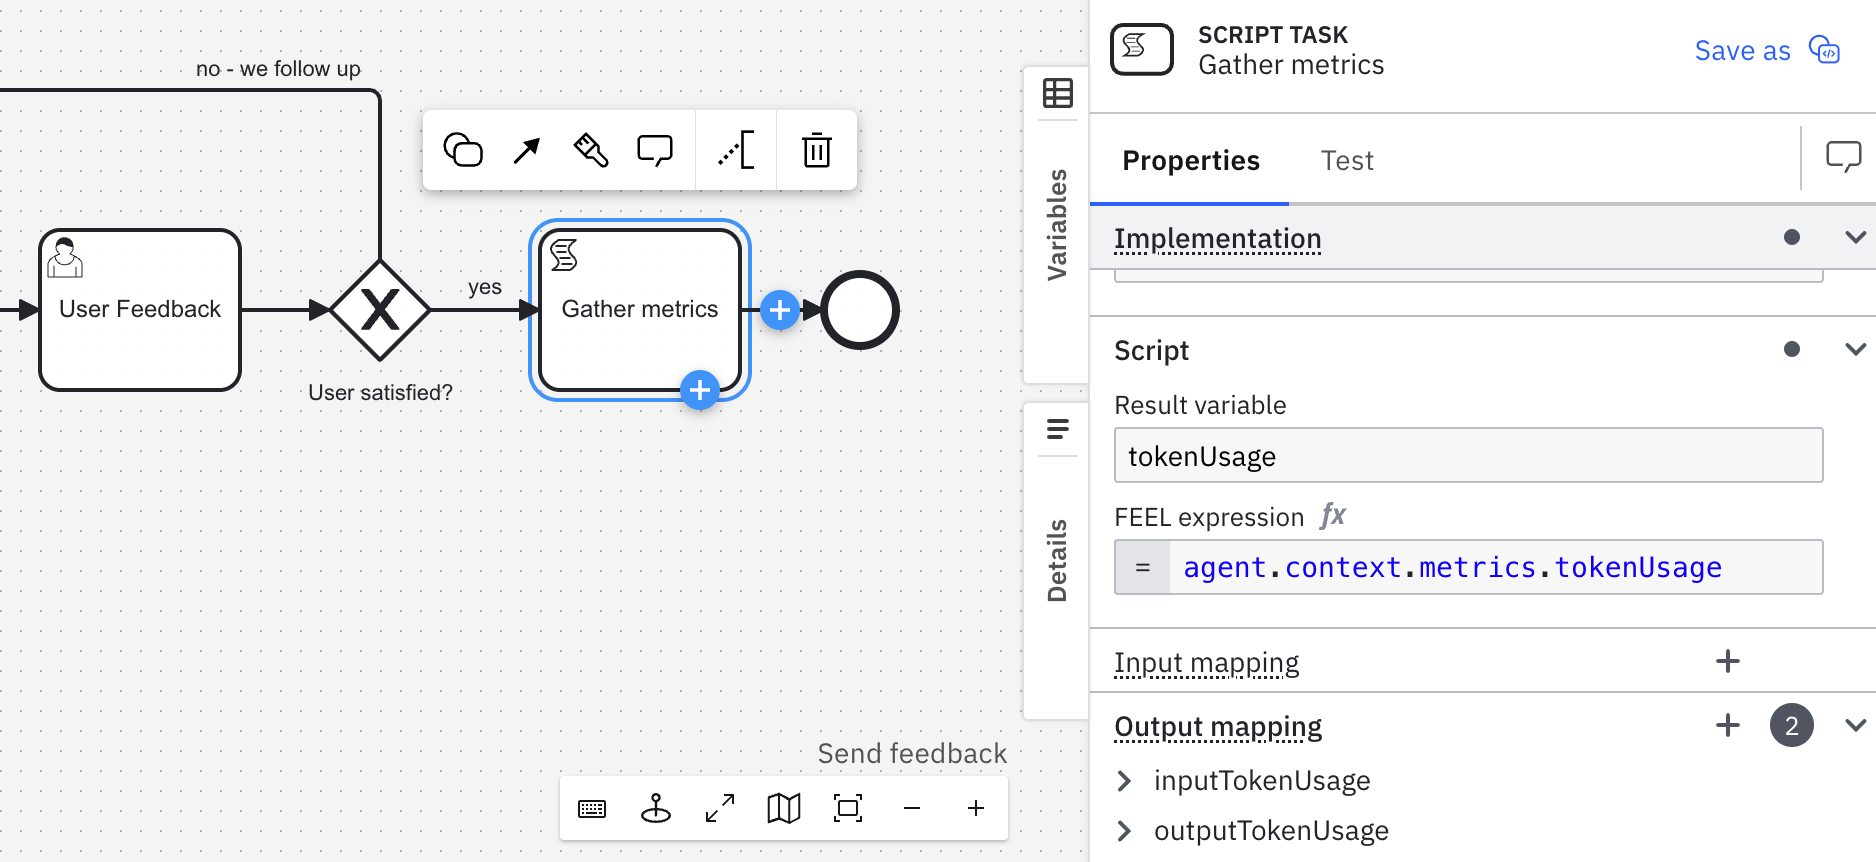
To surface this data, you can add a script task after the AI agent execution that copies the values into process variables as follows:
- Add a script task.
- Configure its Properties:
- Set Name to
Gather metricsunder the General section. - Select FEEL expression as Implementation.
- Under Script:
- Set Result variable to
tokenUsage. - Set FEEL expression to
agent.context.metrics.tokenUsage.
- Set Result variable to
- Under Output mapping, add two process variables:
inputTokenUsagewith Variable assignment value:agent.context.metrics.tokenUsage.inputTokenCount.outputTokenUsagewith Variable assignment value:agent.context.metrics.tokenUsage.outputTokenCount.
- Set Name to
You should see something similar to the following:
Step 2: Examine data in Optimize
You can use Optimize reports and dashboards to examine data collected during process execution and identify areas for improvement in your AI agent processes.
- Open Optimize.
- Go to the Dashboards tab.
- Select your AI agent process, AI Agent Chat With Tools, in the Process dashboards and KPIs section.
- Verify that Optimize shows data for your executed process instances in the Business Operations section, including your AI agent process model diagram and other statistics below.
- Explore the other metrics shown below in the Business Reporting and Process Improvement sections.
See getting started with Optimize for more details on using Optimize for business intelligence.
Step 3: Create reports for token usage
You can create reports for token usage across process instances and over time.
- Go to the Collections tab.
- Select Report from the Create new dropdown.
- Select AI Agent Chat With Tools from the Select one or more processes dropdown. You can fetch data for all process model versions or customize it.
- Choose a blank template.
- Enable Update preview automatically to make it easier to see the report results as you configure it.
- In the Report setup section, select Variable in the View option, and then select tokenUsage.
- Click the pencil icon and select an aggregation that matches your goal. For example:
- Sum to track total tokens across instances.
- Average to track typical usage per process instance.
- Save the report with a descriptive name. For example, Token usage.
You can create similar reports, targeting other goals and process variables, such as inputTokenUsage or outputTokenUsage.
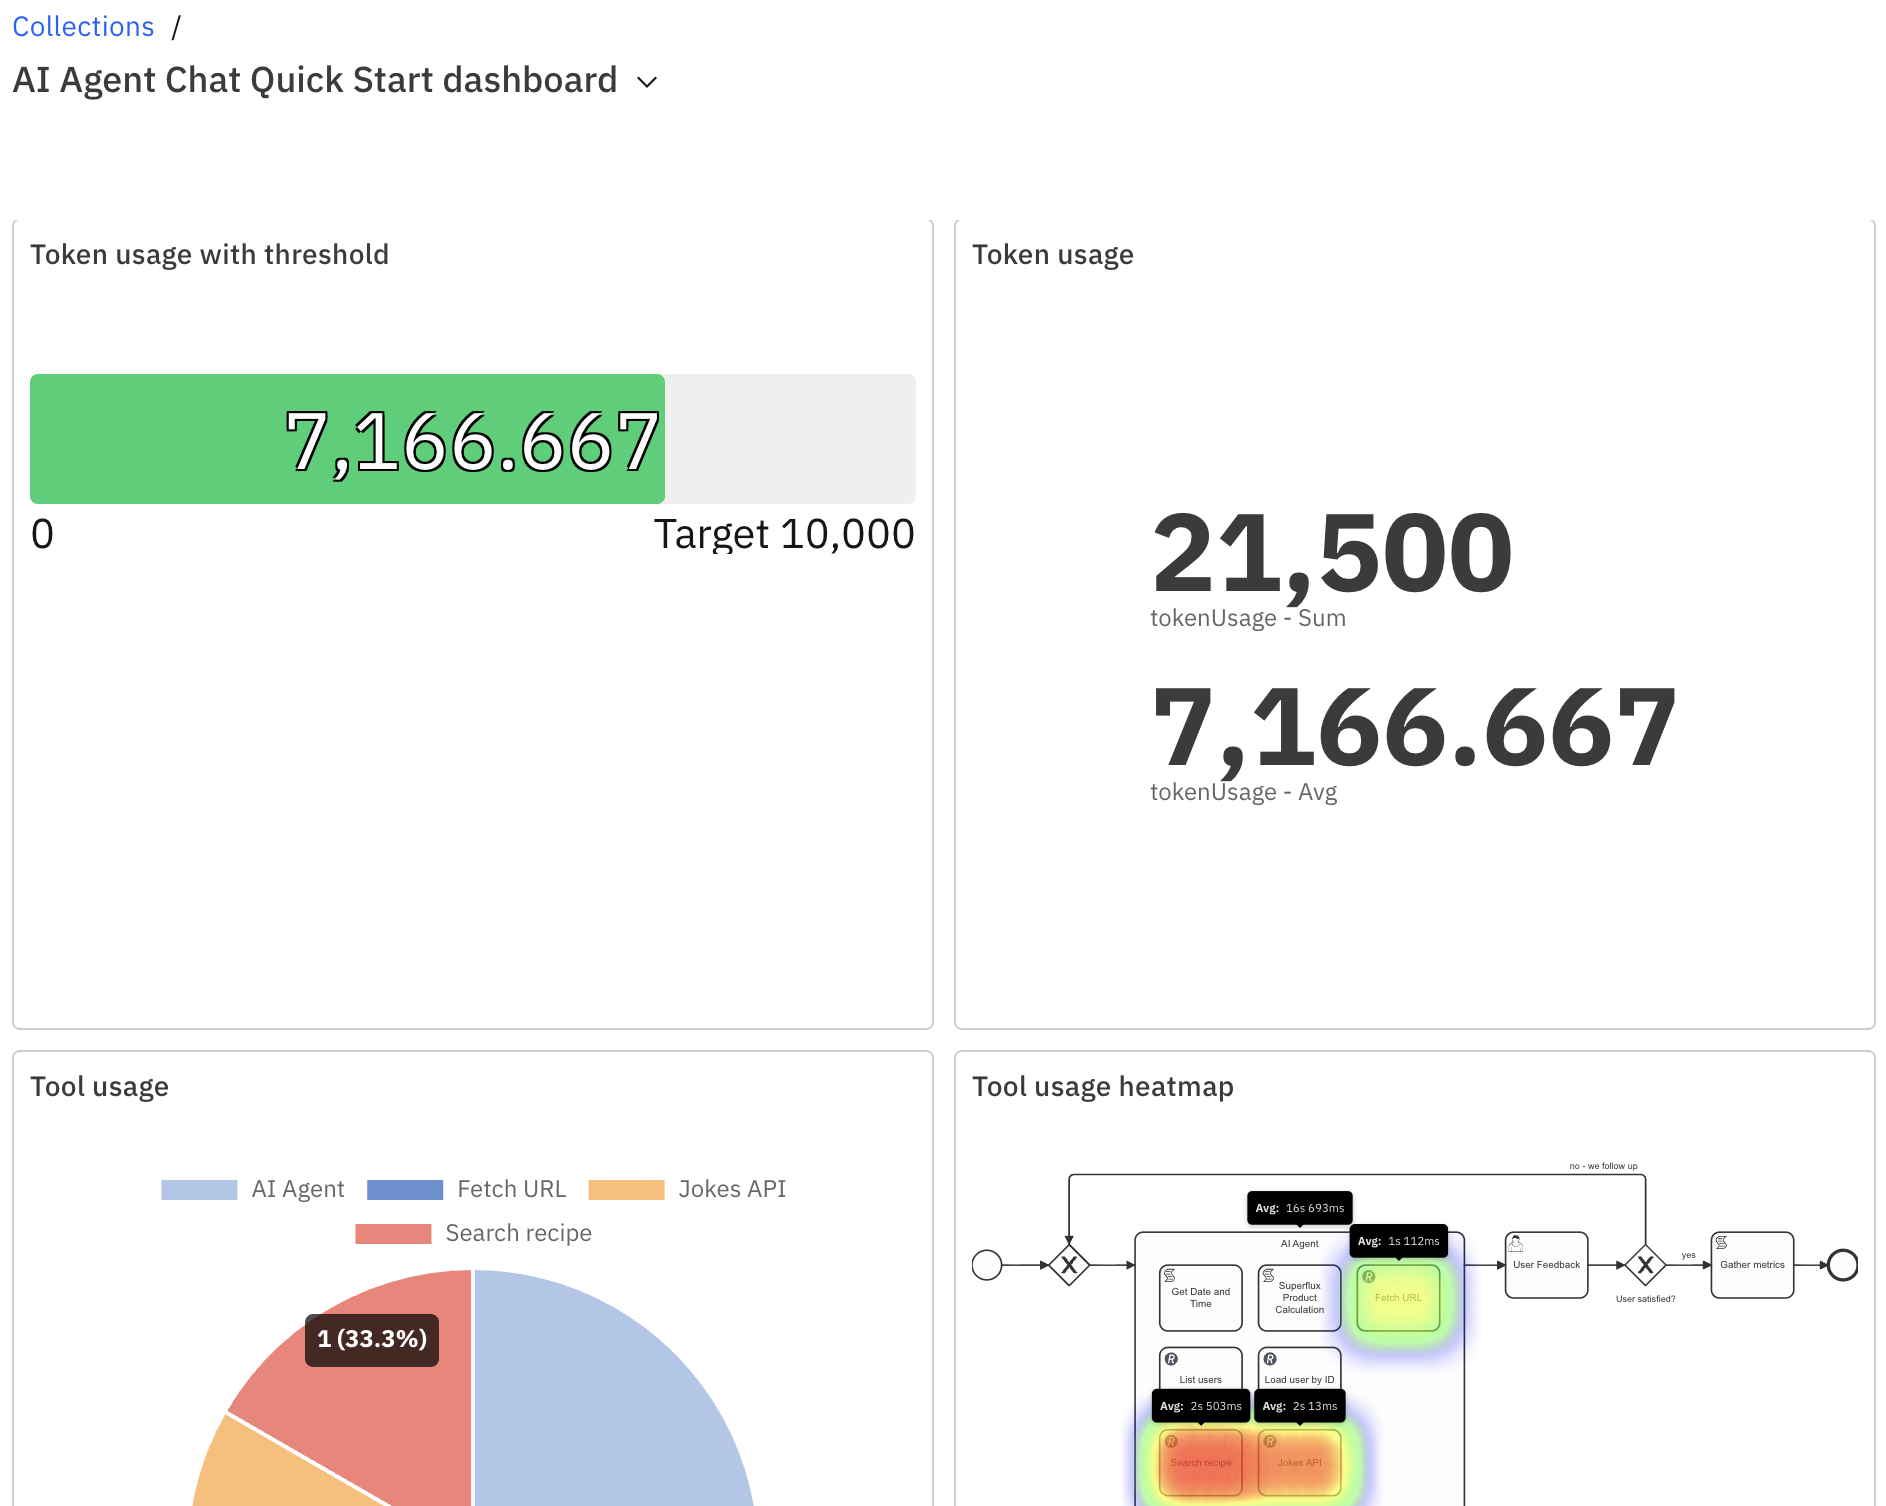
Example: Set a target threshold
If you have a token budget, you can set a target in the report.
- Complete steps 1–6 in Step 3: Create reports for token usage.
- In the Visualization settings, click the gear icon and enable Set target to configure a target value. For example, a maximum token usage threshold.
- Set the target threshold to match your budget. For example, select the below option and set it to 10,000 tokens.
- Save the report with a descriptive name. For example, Token usage with threshold.
Step 4: Create reports for tool usage
You can create reports for tool usage across process instances and over time.
Example: Create a heatmap
Use a heatmap to understand how long your AI agent spends in each task.
- Go to the Collections tab.
- Select Report from the Create new dropdown.
- Select Flow node as the View.
- Select Duration as the Measure.
- (Optional) Filter the report by selecting Flow node selection in the Filter flow nodes dropdown. For example, select only tool tasks within the AI Agent connector.
- In the Visualization settings, select Heatmap. Click the gear icon and enable the tooltip to show absolute values.
- Save the report with a descriptive name. For example, Tool usage heatmap.
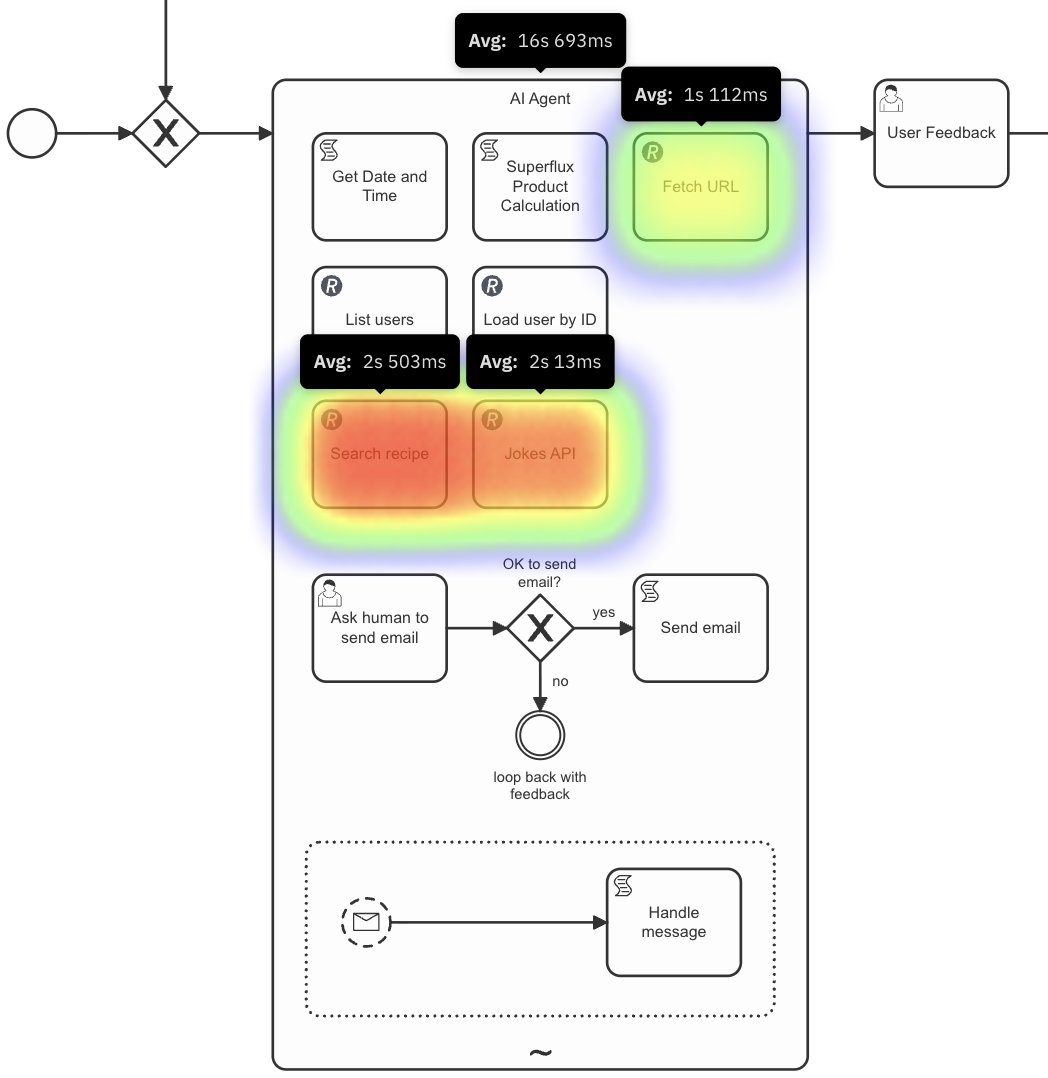
You can see from the heatmap that the Search recipe, Jokes API, and Fetch URL tools are the only ones that were called across all process executions, and that your AI agent spent the most time in Search recipe.
Example: Create a report for tool call counts
Create a bar chart to see how many times each tool is called.
- Go to the Collections tab.
- Select Report from the Create new dropdown.
- Select Flow node as View.
- Select Count as the Measure.
- (Optional) Filter the report by selecting Flow node selection in the Filter flow nodes dropdown. For example, select only tool tasks within the AI Agent connector.
- In the Visualization settings, select Bar chart or Pie chart. Then click the gear icon and enable both tooltips to show absolute and relative values.
- Save the report with a descriptive name. For example, Tool usage.
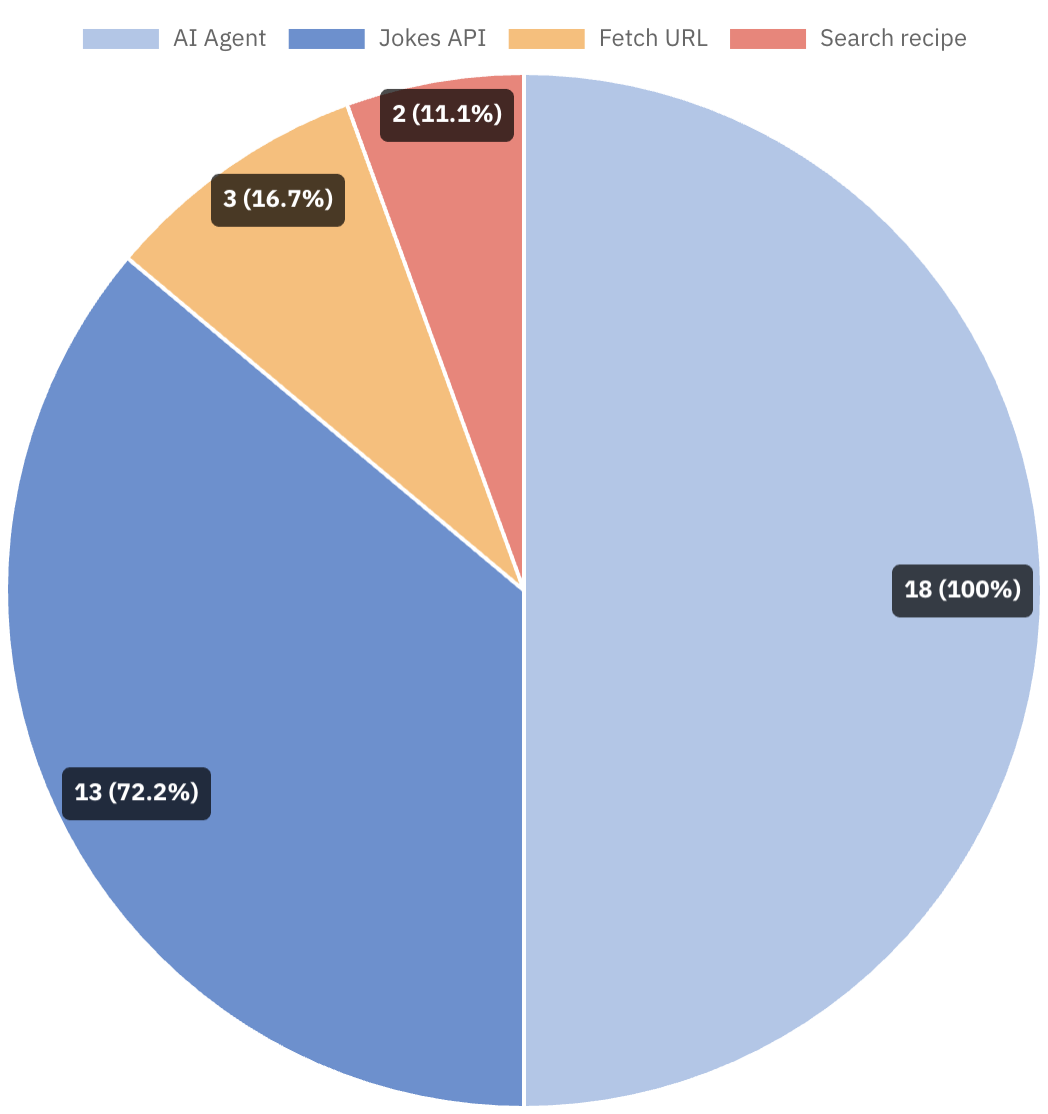
You can see from the pie chart that the AI agent called the Jokes API tool most often across all process executions.
Example: Track trends over time
Use a timeline report to analyze trends over time. For example, you can see how many times a tool is called per day over a one-week period.
- Go to the Collections tab.
- Select Report from the Create new dropdown.
- Select Flow node as View.
- Select Count as the Measure.
- In Group by, select Start date. Then choose your preferred interval, for example, Week.
- (Optional) Filter the report by selecting Flow node selection in the Filter flow nodes dropdown. For example, select only tool tasks within the AI Agent connector.
- In the Visualization settings, select Bar chart or Line chart. Then click the gear icon and enable both tooltips to show absolute and relative values.
- Save the report with a descriptive name. For example, Tool usage over time.
Step 5: Build a dashboard
You can create a dashboard, which is a collection of reports that you can view together, for your AI agent process.
- Go to the Collections tab.
- Select Dashboard from the Create new dropdown.
- Click the plus icon to add tiles for the reports you created.
- In the Optimize report section, add reports as needed.
- Arrange the tiles to customize your dashboard layout.
- Save the dashboard with a descriptive name. For example, AI Agent Chat Quick Start dashboard.
Next steps
Now that you know how to analyze your AI agents, you can:
- Monitor your AI agents with Operate.
- Learn more about Camunda agentic orchestration and the AI Agent connector.