Monitor your AI agents with Operate
Monitor and troubleshoot your AI agent process instances in real time using Operate.
About
In this guide, you will:
- Inspect an AI agent process instance in Operate.
- Understand agent’s tool usage and metadata such as tool call inputs and results.
- Analyze the agent context and how it is stored.
Operate enables inspection of execution paths, tool usage, and agent metadata. However, certain runtime artifacts, such as document storage contents, may require additional configuration.
After completing this guide, you will be able to inspect, debug, and monitor AI agent executions in Camunda 8.
Prerequisites
- You have access to Operate.
- You have the AI Agent Chat Quick Start model blueprint deployed in Modeler.
This guide is a follow-up to Build your first AI agent, where you will use the same example AI agent process. It is recommended going through that guide first. However, it can be applied to other AI agent process implementations.
Step 1: Run your AI agent process
Run your process instance using a prompt to trigger the AI Agent connector. For example:
- Enter "Tell me a joke" in the How can I help you today? field.
- Click Start instance.
Step 2: Open the process instance in Operate
- Open Operate.
- Locate the process instance created by your prompt. See View a deployed process for more details.
- Open your process instance view by clicking on its process instance key.
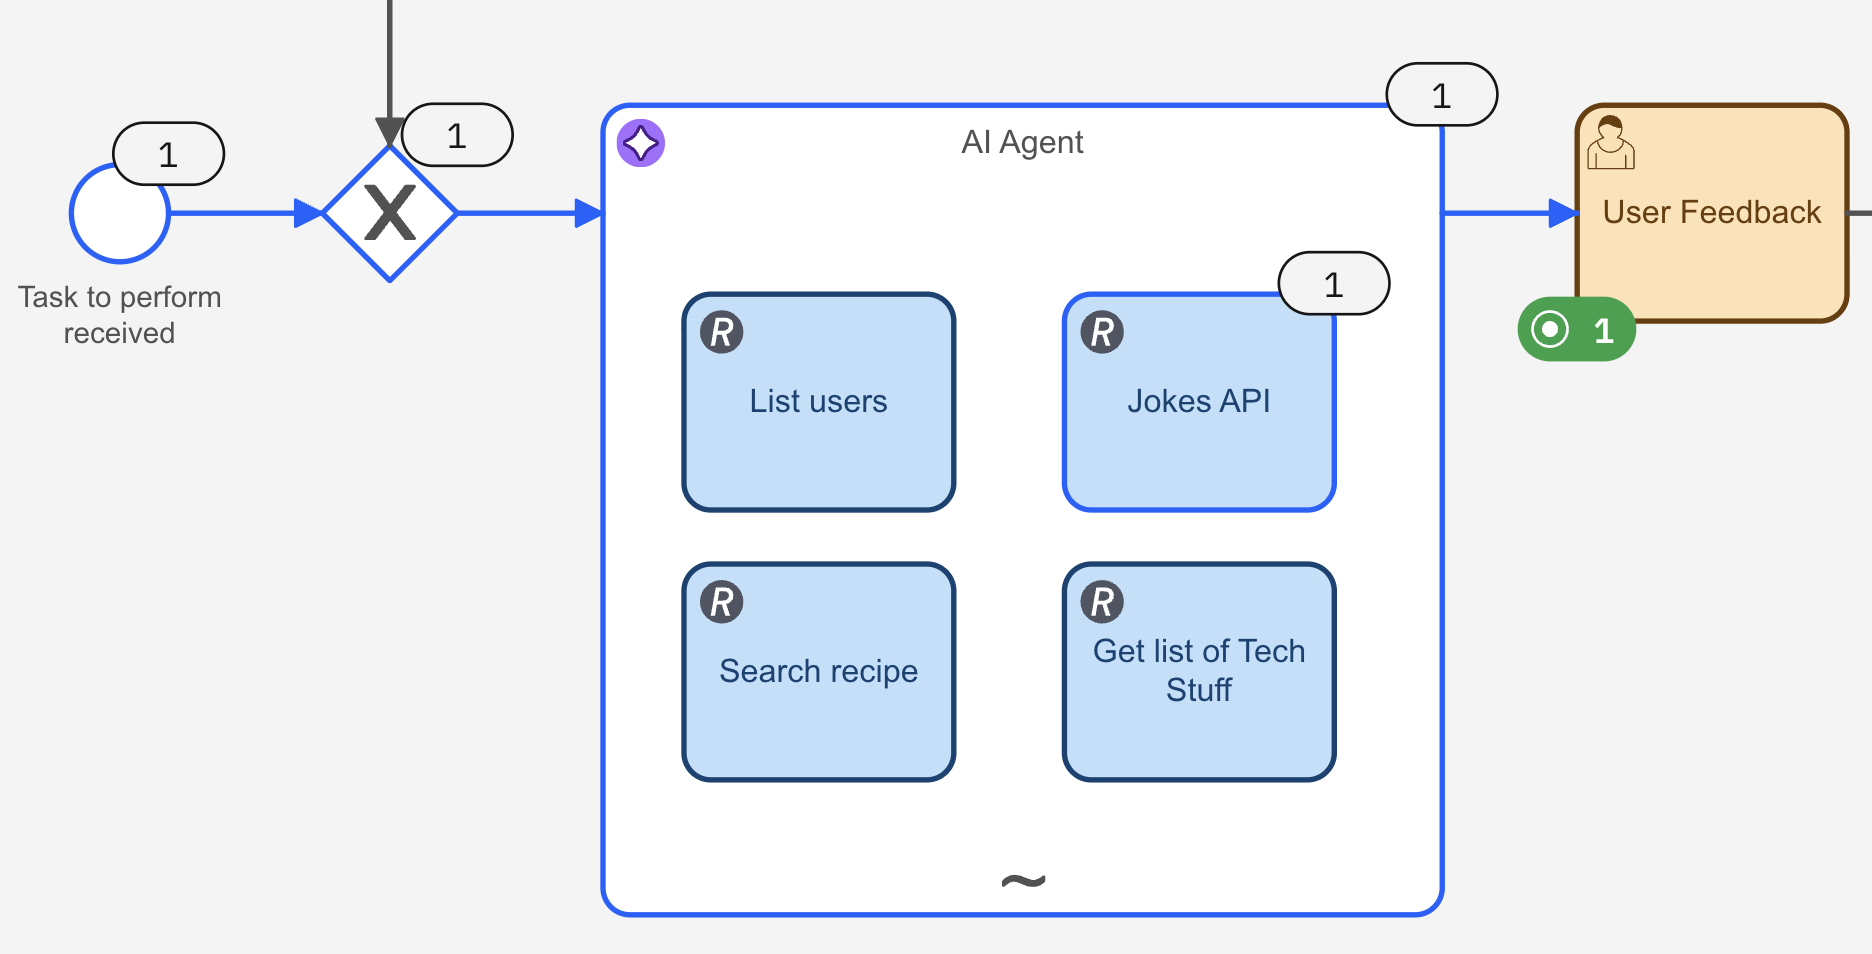
At this point, you should see the process progressing through your model:
Step 3: Understand what Operate shows
With Operate, you can track the agent activity and see which tool tasks are called.
-
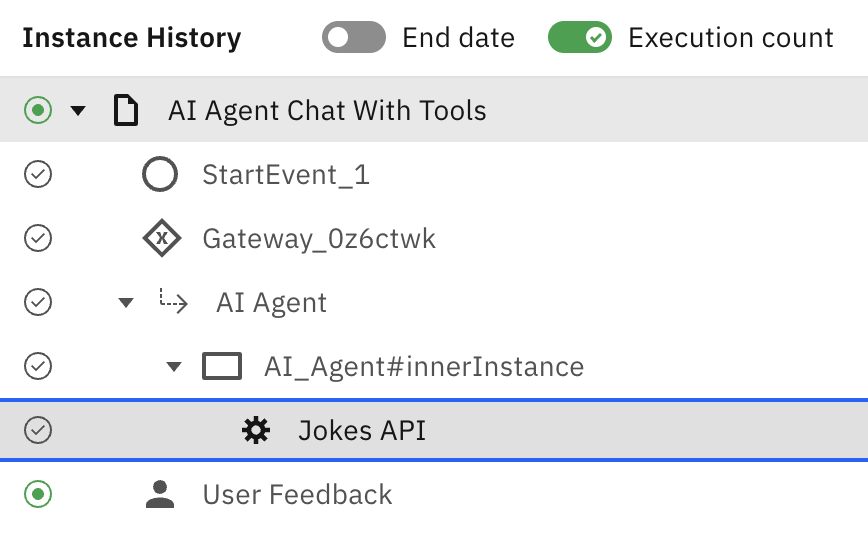
To show how many times each BPMN element is triggered, select Execution count in the Instance History section. For this particular prompt example, you can see:
- The AI Agent connector was triggered once.
- Within it, the agent executed the Jokes API tool.
-
Select the Jokes API tool element:
- In the bottom-left pane, you can see where the element belongs in the execution tree:
- In the bottom-left pane, you can see where the element belongs in the execution tree:
- In the bottom-right pane, the element details are displayed, including the Variables and Input/Output Mappings columns, among others. However, the actual tool inputs and results are stored in a parent scope and are accessible via the element's inner instance in the execution tree. See Step 4: Inspect tool calls for more details.
Step 4: Inspect tool calls
Each tool execution produces an inner instance where you can find:
- The inputs passed into the tool.
- The results.
To see the Jokes API tool input and results:
- In the execution tree, select the AI_Agent#innerInstance parent element of the Jokes API tool. You will see:
- The
toolCallvariable (the input). - The
toolCallResultvariable (the results). See Tool call responses for more details.
- The
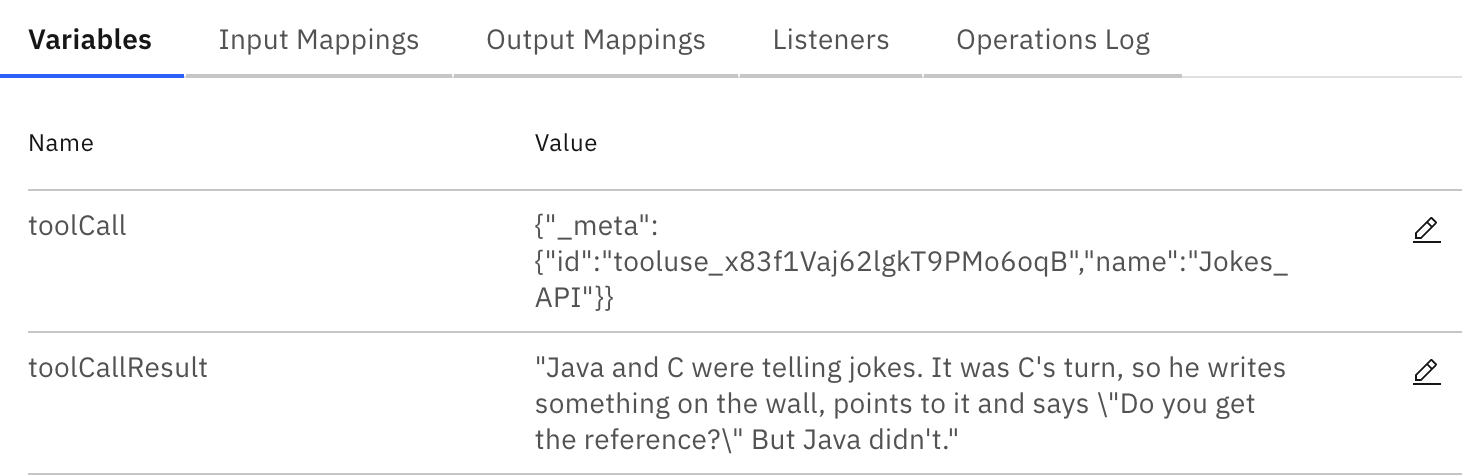
- To better inspect the results, click the pencil icon to enter edit mode for
toolCallResult. - Click the two-arrow icon to open the JSON editor modal. With this, you can inspect the full payload of the variable value:
{
  "Java and C were telling jokes. It was C's turn, so he writes something on the wall, points to it and says \"Do you get the reference?\" But Java didn't."
}
If a tool is executed more than once, select the desired tool invocation in Instance History, then open the corresponding inner instance to view the actual inputs and results.
Step 5: Analyze the agent context
Within the AI Agent connector, you can examine the agent context. To view it:
- Select the AI Agent element in the execution tree.
- To better inspect the value, click the pencil icon to enter edit mode for the
agentContextvariable. - Click the two-arrow icon to open the JSON editor modal. With this, you can inspect the full payload of the variable value.
In the JSON payload, you can find information about:
- Defined tools.
- The conversation, including your prompts and agent's replies.
- Tool calls invoked by the agent.
- Tool call inputs and results.
- Additional metadata, such as reasoning traces and token usage.
Here’s a snippet of the example conversation stored in the agent’s context:
"type": "in-process",
"conversationId": "3889288d-5904-485f-bdca-48ad1f1ef679",
"messages": [
  {
    "role": "system",
    "content": [
      {
        "type": "text",
        "text": "You are a helpful, generic chat agent which can answer a wide amount of questions based on your knowledge and an optional set of available tools.\n\nIf tools are provided, you should prefer them instead of guessing an answer. You can call the same tool multiple times by providing different input values. Don't guess any tools which were not explicitely configured. If no tool matches the request, try to generate an answer. If you're not able to find a good answer, return with a message stating why you're not able to.\n\nIf you are prompted to interact with a person, never guess contact details, but use available user/person lookup tools instead and return with an error if you're not able to look up appropriate data.\n\nThinking, step by step, before you execute your tools, you think using the template `<thinking><context></context><reflection></reflection></thinking>`"
      }
    ]
  },
  {
    "role": "user",
    "content": [
      {
        "type": "text",
        "text": "Tell me a joke"
      }
    ],
    "metadata": {
      "timestamp": "2026-04-06T09:53:19.224987296Z"
    }
  },
  {
    "role": "assistant",
    "content": [
      {
        "type": "text",
        "text": "<thinking>\n<context>\nThe user is asking for a joke. I have access to a Jokes_API function that can fetch a random joke from a REST API. This seems like the perfect tool to use for this request. The function doesn't require any parameters, so I can call it directly.\n</context>\n<reflection>\nThis is a straightforward request that matches exactly with one of my available tools. I should use the Jokes_API function to get a random joke for the user.\n</reflection>\n</thinking>"
      }
    ],
    "toolCalls": [
      {
        "id": "tooluse_x83f1Vaj62lgkT9PMo6oqB",
        "name": "Jokes_API",
        "arguments": {}
      }
    ],
Step 6: Understand how agent memory is stored
In Modeler, within the AI Agent sub-process, you can define how the conversation memory is stored using the Memory storage type field.
By default, agent memory uses the In Process type, which stores it as part of the agent context. With this option, you can view it in Operate within the agent context, as you did in the previous step, Analyze the agent context.
With the Camunda Document Storage option instead:
- You can't view the full conversation and chain-of-thought traces in Operate. Operate only show a document reference and metadata.
- Use this option for long conversations, where Operate variable limits might be exceeded.
See Memory for more details.
- Use In Process for testing and debugging scenarios: Better visibility in Operate.
- Use Camunda Document Storage for production scenarios: Better scalability and runtime behavior for long contexts.
Step 7: Review the results
Go back to Operate. In the User Feedback element, you will see the execution count in green. This means the process instance execution is stopped there and waiting for action.
In this case, the required action is to provide feedback on the agent results. To do so:
- Select the User Feedback element.
- Open Tasklist.
- Select the user feedback task and assign to yourself by clicking Assign to me.
- Analyze the result. You will see a joke, as requested in the prompt.
- You can follow up with more prompts to continue testing your AI agent.
- Select the Are you satisfied with the result? checkbox when you want to finish the process, then click Complete task.
- Go back to Operate. You will see the process instance is now completed, and the end event has been triggered.
Next steps
Now that you know how to monitor your AI agents, you can:
- Analyze your AI agents with Optimize.
- Learn more about Camunda agentic orchestration and the AI Agent connector.