Configure monitoring systems to scrape metrics
Configure your monitoring systems to scrape metrics from a Camunda 8 SaaS cluster using the Cluster Metrics endpoint.
Before you begin
Before configuring metric scraping, ensure that:
- The Cluster Metrics endpoint is enabled for your Camunda 8 SaaS cluster.
- You have the metrics endpoint URL and authentication credentials.
- Your monitoring system can reach the endpoint from an allowlisted IP address.
For information about the Cluster Metrics endpoint monitoring model and limitations, see Cluster Metrics endpoint.
Metrics endpoint details
The metrics endpoint:
- Uses HTTPS
- Requires Basic Authentication
- Returns metrics in Prometheus format
Endpoint format
The full metrics endpoint follows this format: https://<metrics-target>/<cluster-id>
<metrics-target>: The domain hosting the metrics endpoint.<cluster-id>: The identifier of the Camunda 8 SaaS cluster.
Verify endpoint access
Before configuring your monitoring system, use the following command to verify that the Cluster Metrics endpoint is reachable:
curl -v -u "<username>:<password>" https://<metrics-target>/<cluster-id>
Configure Prometheus scraping
Prometheus can scrape the Cluster Metrics endpoint directly.
Example scrape configuration
scrape_configs:
  - job_name: "c8-<cluster-id>"
    scheme: https
    metrics_path: /<cluster-id>
    static_configs:
      - targets:
          - <metrics-target>
    basic_auth:
      username: <username>
      password: <password>
    scrape_timeout: 5s
    scrape_interval: 30s
Configuration notes:
- Use HTTPS.
- Configure Basic Authentication using the credentials provided when the Cluster Metrics endpoint was enabled.
- A scrape timeout of less than 10 seconds is recommended.
- A scrape interval of at least 15 seconds is recommended. Metrics are collected every 15–30 seconds, so shorter intervals do not produce new data.
Scrape interval and retention
The Cluster Metrics endpoint exposes metrics from the most recent scrape only and does not retain historical data.
Configure your monitoring system to store and retain metrics as needed.
Verify metric collection
After configuring scraping:
- Confirm that the scrape target reports a healthy state.
- Check that metrics correspond to the expected Camunda 8 cluster.
If metrics do not appear, review authentication, network access, and scrape configuration.
Example dashboards
Camunda provides example Grafana dashboards in a public GitHub repository that you can use to explore and visualize Cluster Metrics.
These dashboards serve as reference examples and may rely on additional metric sources, such as kube-state-metrics or node-exporter. You can adapt them to match your monitoring conventions, alerting rules, and operational requirements. Available metrics can vary depending on the Camunda version running in your cluster.
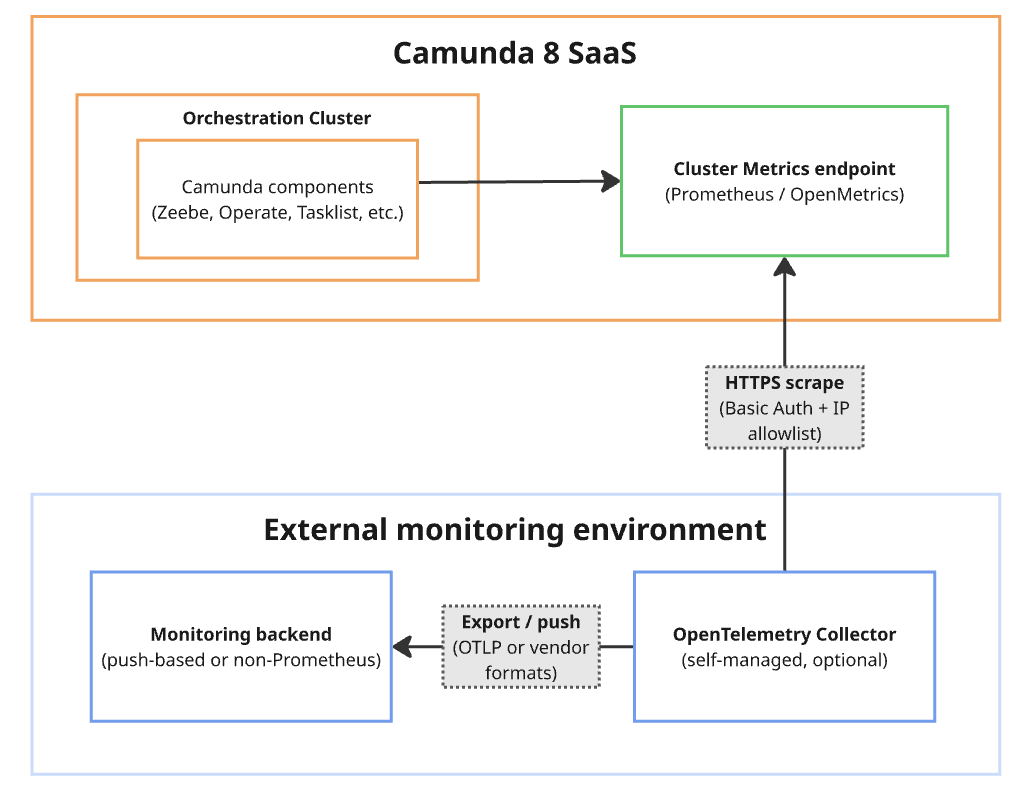
Integrate non-Prometheus monitoring systems
The Cluster Metrics endpoint exposes metrics in Prometheus-compatible formats. Some monitoring systems require additional components to ingest these metrics.
In these cases, you can deploy a self-managed OpenTelemetry Collector to adapt the metrics to your monitoring system. For more information, see the OpenTelemetry Collector documentation.
Using an OpenTelemetry Collector allows you to normalize, enrich, and control the flow of metrics scraped from the Cluster Metrics endpoint. For example, you can:
- Transform metrics to match internal naming conventions
- Filter metrics to reduce noise or control ingestion costs.
- Enrich metrics with standard labels such as environment or region.
- Forward metrics to one or more monitoring backends.
- Manage scrape behavior, buffering, retries, and backpressure without changing how Camunda exposes metrics.
Push-only monitoring systems
If your monitoring system only supports push-based ingestion, use the following approach:
- Deploy a self-managed OpenTelemetry Collector.
- Configure the collector to scrape the Cluster Metrics endpoint.
- Configure the collector to push metrics to your monitoring system.
Camunda provides the metrics endpoint only. You are responsible for deploying, configuring, and operating the collector.
Non-Prometheus metric formats
If your monitoring system requires a format other than Prometheus, use an OpenTelemetry Collector with the appropriate exporter.
The OpenTelemetry Collector supports a wide range of exporters, allowing you to forward metrics to different monitoring backends.
For more information, see OpenTelemetry Collector exporters.
Troubleshoot common issues
Authentication errors
- Verify the configured username and password.
- Check that the monitoring system’s IP address is allowlisted.
Scrape timeouts
- Increase the configured scrape timeout.
- Verify network connectivity to the metrics endpoint.
Missing or incomplete metrics
- Confirm that the Cluster Metrics endpoint for the cluster is enabled and healthy.
- Verify that the cluster is running a supported Camunda version.
- Review scrape interval and retention behavior.